While the situation in Ukraine is and will remain very fluid, as of now, World Vision is on the ground in Romania providing shelter, necessities, and psychosocial support to people who have crossed the border - mostly women and their children. And on Saturday, our World Vision Romania team was able to deliver food and critical non-food items to a 600-bed hospital inside Ukraine which is serving as a temporary shelter for displaced children and their families. We will continue to provide support for Ukrainians in this time of great need.
Our Global WASH Business Plan is based on the values of people, accountability, and leadership. As we live into these values, particularly accountability, it’s been our ambition to improve on the quality of the data we capture and how we share it. This dashboard uses Power BI to allow us to visualize thousands of data points from our global WASH program.
This newsletter will help you learn how to navigate the dashboard. Once you get the feel for it, you’ll be able to discover more than we’ll describe here.
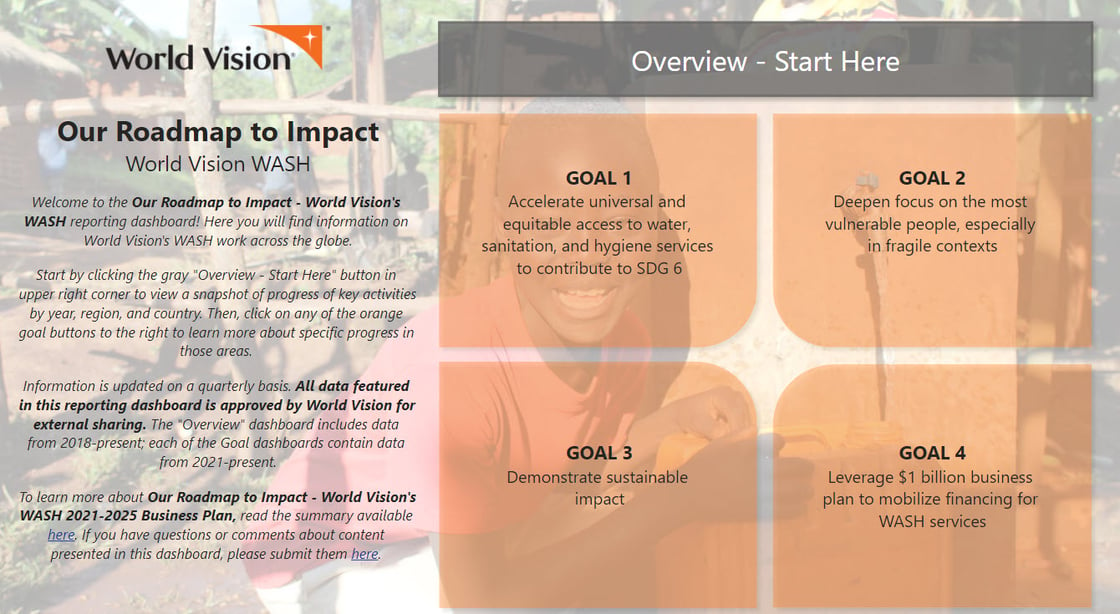
Getting started: When you click on the link, you’ll go to this screen.
If you have trouble accessing the link, open a new browser window and go to www.worldvision.org/waterimpact.
From here you can click on the “Overview – Start Here” at the top to see the impact of our WASH program.
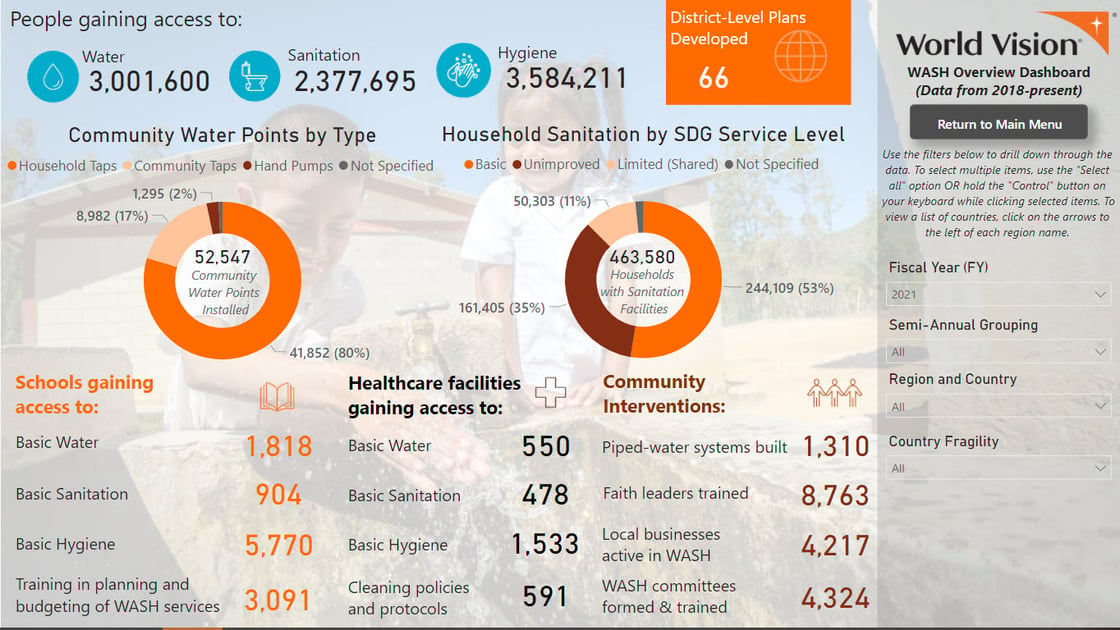
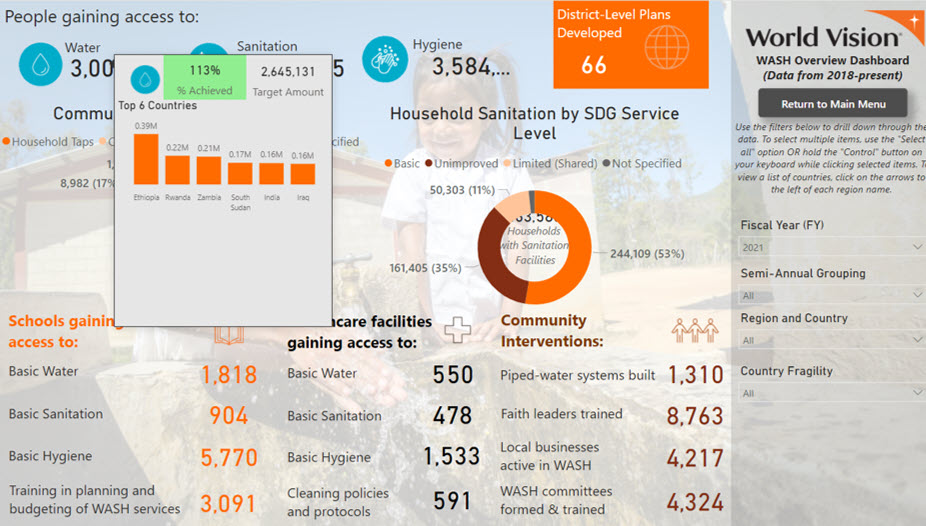
Overview Page: The initial view will be of our global 2021 impact. On the right-hand side of the dashboard, you’ll be able to view results by year, by region, or by individual country. If you hover over the numbers at the top, you’ll be able to view the % achieved, the target, and the top six countries of impact. Below, you can see this for Water Access.
This overview page also shows the community water points by type (as you can see on the Overview Page without the hovering: only 2% were handpumps in 2021 globally), household sanitation by service level, and critical metrics for schools, health care facilities, and communities. Once you’ve explored this page, you can click on “Return to Main Menu” on the upper right-hand side of the page.
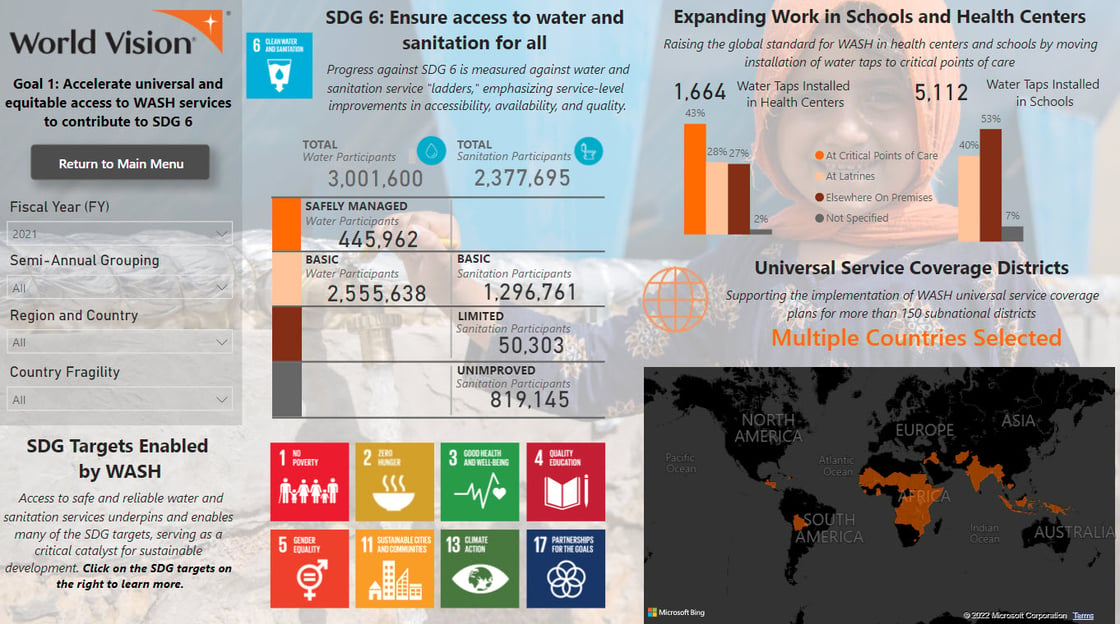
Goal 1 Page: When you click on Goal 1, you’ll be able to view the impact broken out by different levels of services as well by age groups and gender. On the right side of the dashboard we’ve shown more specifics on water provision in schools and health care facilities. The initial view will be global, but you can also view these results broken out by individual country.
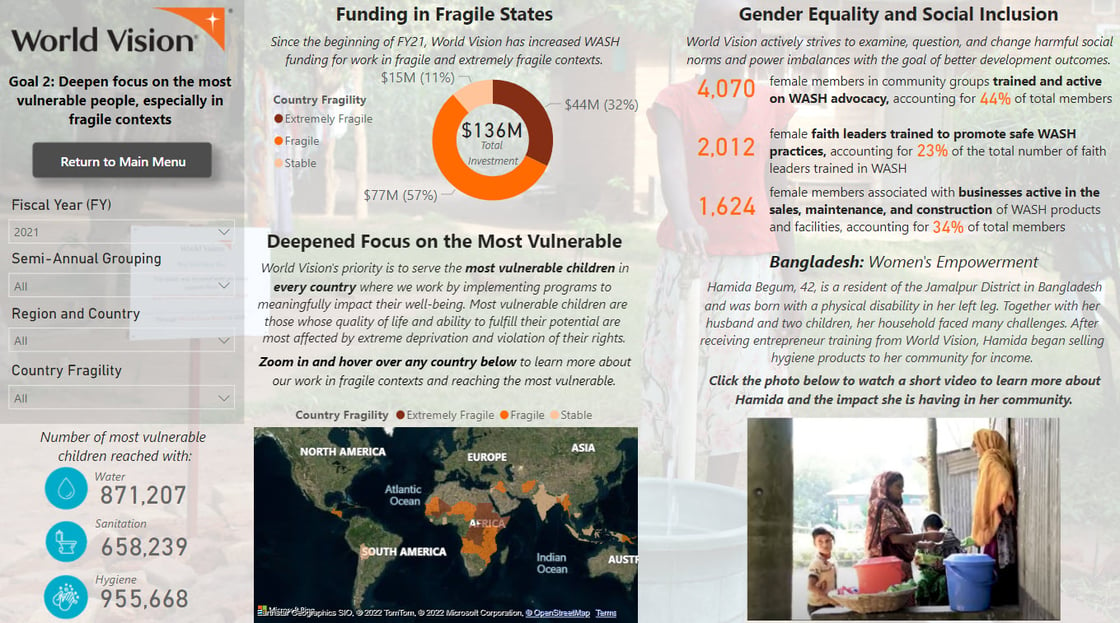
Goal 2 Page: This page of the dashboard will show total funding of our WASH program broken out by whether the funding is going to extremely fragile, fragile, or stable countries. You can see that 89% of our funding was directed towards extremely fragile (32%) or fragile countries (57%).
One of my personal favorite parts of this dashboard is the map at the bottom. By zooming in and hovering over individual countries, you can see how many vulnerable children we’re reaching in each country. This distinction is made at a local level, by identifying children most affected by extreme poverty and violation of their rights. That’s taking an enormous amount of data through this platform and allowing you to see it instantly.
The Goal 2 Page also shows some of gender equity metrics including the number of women trained in advocacy, the number of women faith leaders trained, and the number of women associated with businesses active in selling WASH products and facilities.
Goal 3 Page: On this page, you can learn about our research and learning program by country.
Goal 4 Page: On this page, you can see how we’re using private donor funds to multiply our impact. This is the basis for our ability to take $1 of private donor investment in our Global Water Program and use it to generate another $4 for a total impact of $5.
At the recent WASH Forum, Jordan Smoke navigated us through the dashboard which provides a nice tutorial on how to use the dashboard, as well as an overview of our 2021 results. You can view that 13-minute video here.
As with any new innovation, we will continue to refine and improve the dashboard. We’ll update the dashboard every six months, as data comes in from the 41 countries from our 2021-2025 WASH Business plan. I'd welcome your feedback on the dashboard.
World Vision in the News
I was recently interviewed by candidates for a Masters’ degree in Humanitarian & Disaster Leadership at Wheaton College which was edited and appeared in Christianity Today’s Blog Forum. It provides a nice overview of our work.
World Water Day Event
Join us on March 22, World Water Day, at 4 pm PT/7 pm ET for a live fund-raising event with the goal of raising $3 million in order to provide 60,000 people with clean water. This is part of an effort to finish the job and reach everyone, everywhere World Vision works in Zambia—about 800,000 people—with access to clean water. www.worldvision.org/WorldWaterDayEvent
Prayer Requests
Prayfor a ceasefire, peace, and for protection of the Ukrainian people - especially the children
Give thanks for the favor that God continues to show for World Vision’s water efforts and the culture of continual learning and improvement so we can be faithful stewards of the resources provided by our donors
Pray for the success of our World Water Day event and that we can exceed our goal of providing clean water to 60,000 people in Zambia
World Vision is a Christian humanitarian organization dedicated to working with children, families, and their communities worldwide to reach their full potential by tackling the causes of poverty and injustice. Motivated by our faith in Jesus Christ, we serve alongside the poor and oppressed as a demonstration of God’s unconditional love for all people. World Vision serves all people, regardless of religion, race, ethnicity, or gender.
In 2020, 88% of World Vision's total operating expenses were used for programs that benefit children, families, and communities in need. Learn More.
World Vision, P.O. Box 9716, Federal Way, WA 98063